Graphing a UDP data stream
Add a Plotly plot of a stream of UDP data packets.
This is the third part of plotting a UDP broadcast data stream. I will add the reading and plotting of the UDP data to the electron app created previously. Just to reiterate the warning from the prior post, this is not production grade, this is just showing the core concepts.
All the development and testing has been done on linux.
Sample Application
The sample application can be found here.
Install Additional Dependencies
We will be installing lodash-es, vueuse core.
npm install lodash-es @types/lodash-es @vueuse/coreModify Electron Main
First step is to edit the file electron/main/index.ts. This project is simpler than the initial scaffolding. The new file should look like:
process.env.DIST_ELECTRON = join(__dirname, '..')
process.env.DIST = join(process.env.DIST_ELECTRON, '../dist')
process.env.PUBLIC = app.isPackaged ? process.env.DIST : join(process.env.DIST_ELECTRON, '../public')

import {app, BrowserWindow} from 'electron'
import {join} from 'path'
import dgram from 'node:dgram';

const udp_port = dgram.createSocket('udp4');

udp_port.on('error', (err) => {
    console.log(`udp_port error:\n${err.stack}`);
    udp_port.close();
});

udp_port.on('listening', () => {
    const address = udp_port.address();
    console.log(`udp_port listening ${address.address}:${address.port}`);
    udp_port.setBroadcast(true);
});

udp_port.bind(9999);

let win: BrowserWindow | null = null
const url = process.env.VITE_DEV_SERVER_URL as string
const indexHtml = join(process.env.DIST, 'index.html')

async function createWindow() {
    win = new BrowserWindow({
        title: 'Main window',
        webPreferences: {preload: join(__dirname, '../preload/index.js')},
    });

    if (app.isPackaged) {
        win.loadFile(indexHtml)
    } else {
        win.loadURL(url)
        win.maximize();
    }
}

app.whenReady().then(createWindow).then(() => {
    udp_port.on('message', msg => win.webContents.send("udp_data", new Float64Array(msg.buffer)));
})
WARNING
It is important to call udp_port.setBroadcast(true). Failing to do this will result in your app not receiving the broadcast on some platforms, while others will work fine. This may lead to confusion.
See the callout below.
udp_port.on('listening', () => {
    const address = udp_port.address();
    console.log(`udp_port listening ${address.address}:${address.port}`);
    udp_port.setBroadcast(true);
});

udp_port.bind(9999);
Note we are binding to port 9999. This is the port our C program from earlier is broadcasting on.
Modify Electron Preload
Next step is to modify electron/preload/index.ts. This new preload will add an object to the client window called ‘api’ with a method called ‘receive’. This method will register a callback on a message channel. The message channel will be sent messages by electron main when it receives UDP data.
const { contextBridge, ipcRenderer } = require('electron')

contextBridge.exposeInMainWorld('api', {
  receive: (channel, listener) => {
    ipcRenderer.on(channel, (event, ...args) => listener(...args));
  },
})
Create The Plotting Vue Component
Remove the HelloWorld.vue file in src/components/. Add a file src/components/DataGraph.vue with the following contents:
<template>
  <div>
    <div ref="plot"></div>
  </div>
</template>

<script setup lang="ts">
import {onMounted, ref, defineProps} from 'vue'
import {watchThrottled} from "@vueuse/core"
import Plotly from 'plotly.js-dist-min'

const plot = ref(null);
interface DataGraphProps {
  data: Array<Array<FloatTimeEntry>>
  labels?: Array<string>
  title?: string
}
const props = defineProps<DataGraphProps>();

const dataHasChanged = (data: Array<Array<FloatTimeEntry>>) => {

  const dataToGraph: Array<XYEntry> = [];
  data.forEach((arrayOfEntries, index) => {

    dataToGraph.push({x: arrayOfEntries.map(item => item.time), y: arrayOfEntries.map(item => item.val)});

    if (props.labels && props.labels[index] !== undefined) {
      dataToGraph[dataToGraph.length - 1].showlegend = true;
      dataToGraph[dataToGraph.length - 1].name = props.labels[index];
    }
  })

  Plotly.react(plot.value!, dataToGraph, {title: props.title});
}

onMounted(() => {

  setTimeout(()=>{

    dataHasChanged(props.data);

    watchThrottled(() => props.data, () => dataHasChanged(props.data),
        {
          deep: true,
          throttle: 200
        });

  }, 100);
});

</script>
TIP
The div wrapping the actual div that will be handed to Plotly is there to allow pass through styling to be applied to the component, otherwise Plotly will override the styling.
Modify App.vue
Modify the sample App.vue to be the following:
<template>
  <header class="flex items-center justify-center p-2 sticky top-0 z-50 border rounded bg-green-300">
    <label class="ml-auto">Collect Data <input type="checkbox" v-model="collectData"></label>
    <button @click="clearData" class="ml-2 border border-black rounded px-2 py-1 bg-orange-400" type="button">Clear Data</button>
  </header>
  <DataGraph
      :data="[sin_data, cos_data]"
      :labels="['Sin','Cos']"
      title="Sin / Cos"
      class="border rounded background-white mx-5 my-2"/>
</template>

<script setup lang="ts">
import DataGraph from './components/DataGraph.vue'
import {ref, reactive} from "vue";
import {throttle} from "lodash-es"

const MAX_BUFFER_LENGTH = 1500;
const collectData = ref(true);
const sin_data = reactive([]);
const cos_data = reactive([]);

const resizeBufferIfNeeded = (buffer: Array<FloatTimeEntry>, length:number) => {
  if(buffer.length > length){
    buffer.splice( 0, buffer.length - length);
  }
};

const addValueToBuffer = (buffer: Array<FloatTimeEntry>, value:number, time:number) => {
  if(!isNaN(value)){
    buffer.splice( buffer.length,0, {time: time, val: value} );
    resizeBufferIfNeeded(buffer, MAX_BUFFER_LENGTH);
  }
};

const clearData = () => {
  sin_data.length = 0;
  cos_data.length = 0;
}

let lastDataValues:Float64Array;
const OFFSETS = new Map();
OFFSETS.set("I", 0);
OFFSETS.set("SIN", 1);
OFFSETS.set("COS", 2);

const handleData = throttle(() => {
  try{
    if( collectData.value && lastDataValues.length !== undefined && lastDataValues.length >= OFFSETS.size){
      addValueToBuffer(sin_data, lastDataValues[OFFSETS.get("SIN")],  lastDataValues[OFFSETS.get("I")]);
      addValueToBuffer(cos_data, lastDataValues[OFFSETS.get("COS")],  lastDataValues[OFFSETS.get("I")]);
    }
  }catch (e) {
    console.error(e)
  }
},200)

window.api.receive("udp_data", (values:Float64Array) =>{
  lastDataValues = values;
  handleData();
});
</script>
Add/Edit Typescript .d.ts Files
Add/Edit the required Typescript def files.
Edit src/env.d.ts to be the following:
export {};

declare module '*.vue' {
    import type { DefineComponent } from 'vue'
    // eslint-disable-next-line @typescript-eslint/no-explicit-any, @typescript-eslint/ban-types
    const component: DefineComponent<{}, {}, any>
    export default component
}
declare global {
    interface Window {
        api: any
    }

    interface FloatTimeEntry {
        val: number
        time: date
    }

    interface XYEntry {
        x: Array<number>
        y: Array<number>
        showlegend?: boolean
        name?: string
    }
}
Edit electron/electron-env.d.ts to be:
declare namespace NodeJS {
  interface ProcessEnv {
    DIST: string
    PUBLIC: string
  }
}
Test
To test the graphing the C UDP broadcast program written in the first post in this series needs to be run on a separate machine.
Make sure there are no firewall restrictions for UDP traffic on port 9999. The C program is using 192.168.0.255 as the broadcast address, so make sure that the electron app has access to the 192.168.0.X subnet.
Start the C program.
Next start the electron app.
npm run devIf all worked you should see the following:
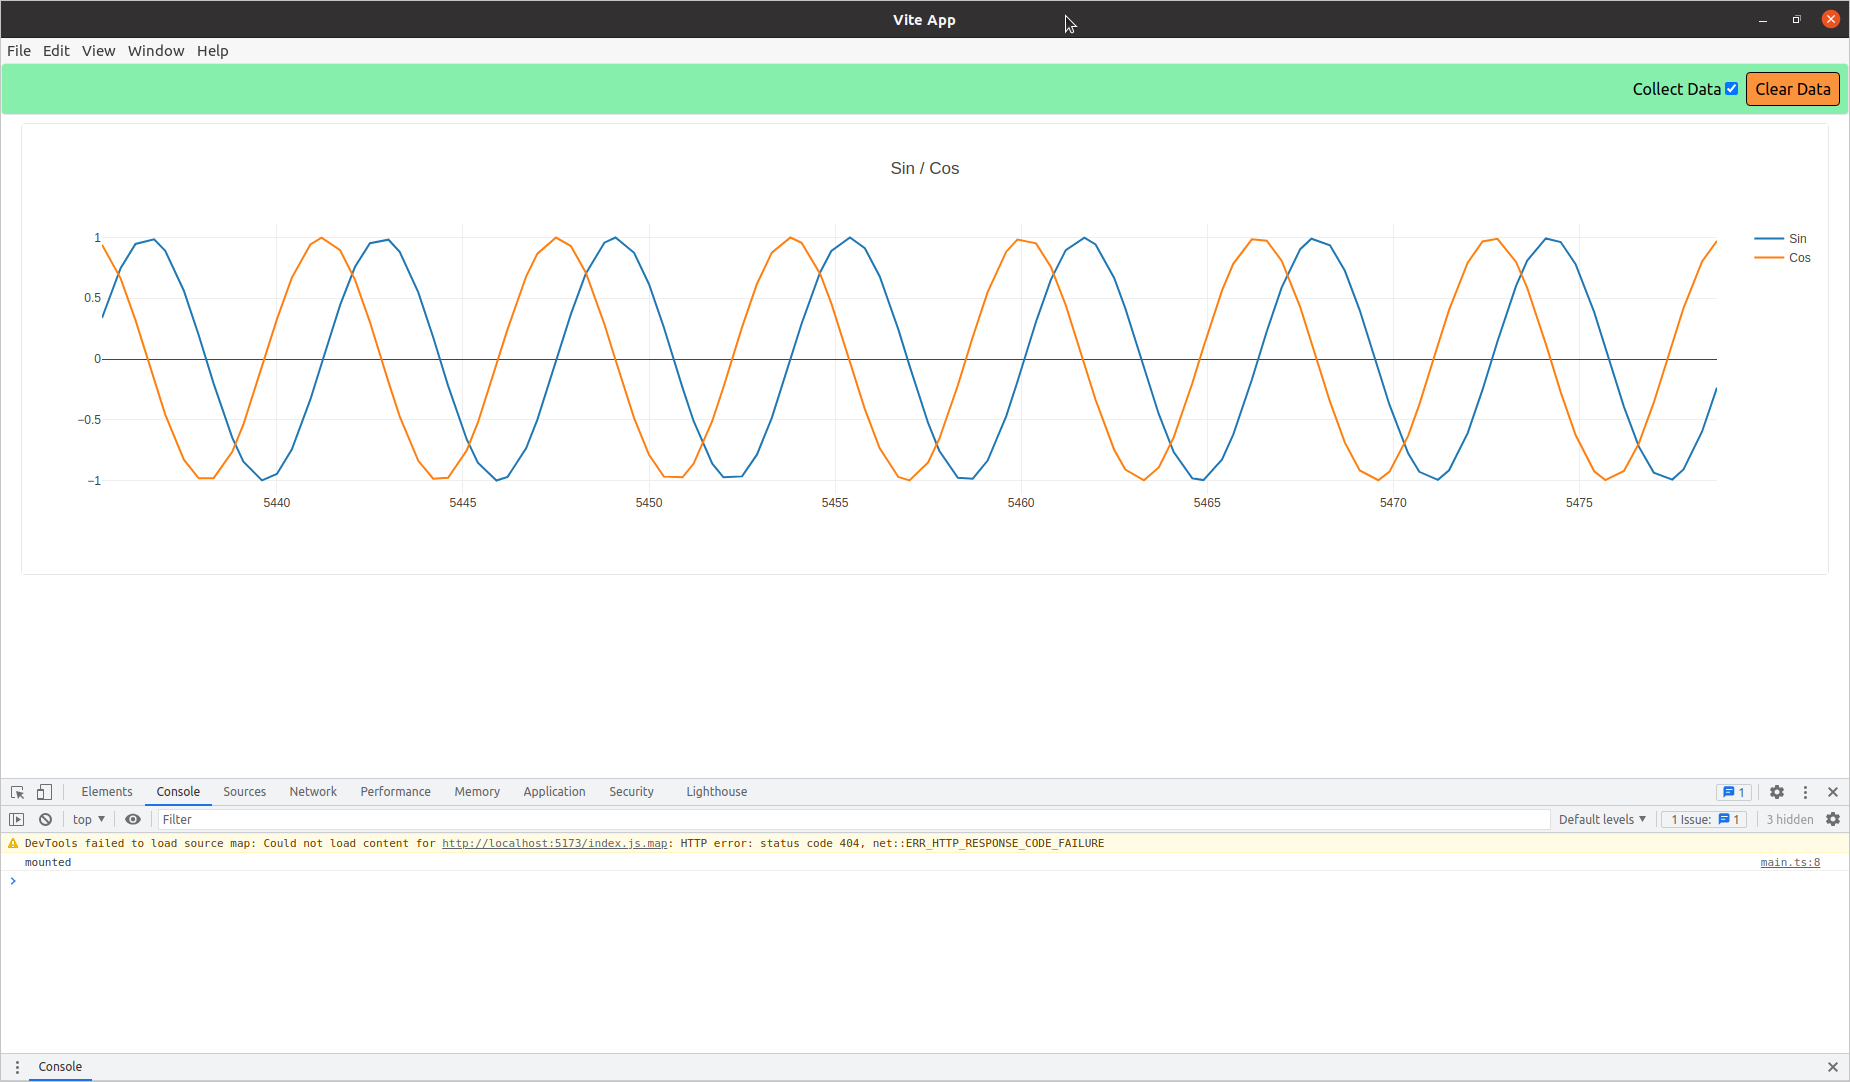
Sin and Cos graphed.
Conclusion
There were many moving pieces to get correct in this series of posts. Hopefully you have had success.
If you have run into issues some things to verify are:
- You have a recent version of Node/NPM.
- The C and Electron apps are running on different machines that have network access to each other.
- Open wireshark on the machine running the Electron app. Verify that you see the UDP packets.
- If not seeing packets on the Electron host, do the same on the C program host machine.
- If seeing packets on the C host but not the Electron host and can ping between them, check the firewall.